> ## Documentation Index
> Fetch the complete documentation index at: https://docs.archetypeai.app/llms.txt
> Use this file to discover all available pages before exploring further.
# Machine State Lens
> Learn how to use the Machine State Lens with CSV files.
The **Machine State Lens** classifies the operational state of a machine using its sensor measurements. Use the [Machine State Lens](/core-concepts/lenses/lens-templates/machine-state) to analyze time series sensor data and detect different machine states from your CSV files.
## 1. Access the Workbench
Use your API key and log into the [Console](https://console.u1.archetypeai.app/workbench). Click on "Workbench" in the navigation bar.
Make sure you have an active api key for the Archetype platform, and you're able to login to the console. If you have any problems, please contact [support@archetypeai.](mailto:support@archetypeai.dev)dev
## 2. Select a Lens
In the Workbench, the Lens name appears at the bottom of the screen. Click the name to open a tray showing all lenses available to your organization.
Select the lens named 'Machine State Lens' from the lens tray.
## 3. Upload Your CSV File
The Machine State Lens works with time series data in .CSV format.
At the top right of the input panel, you'll see a dropdown called "select.csv". Select a .CSV file you've already uploaded, or upload your own.
We can start with this vibration example: [data.csv](https://drive.google.com/file/d/1zizePdJ1gsUHI-6Kp3Jfe22QJwjxuz28/view?usp=drive_link).
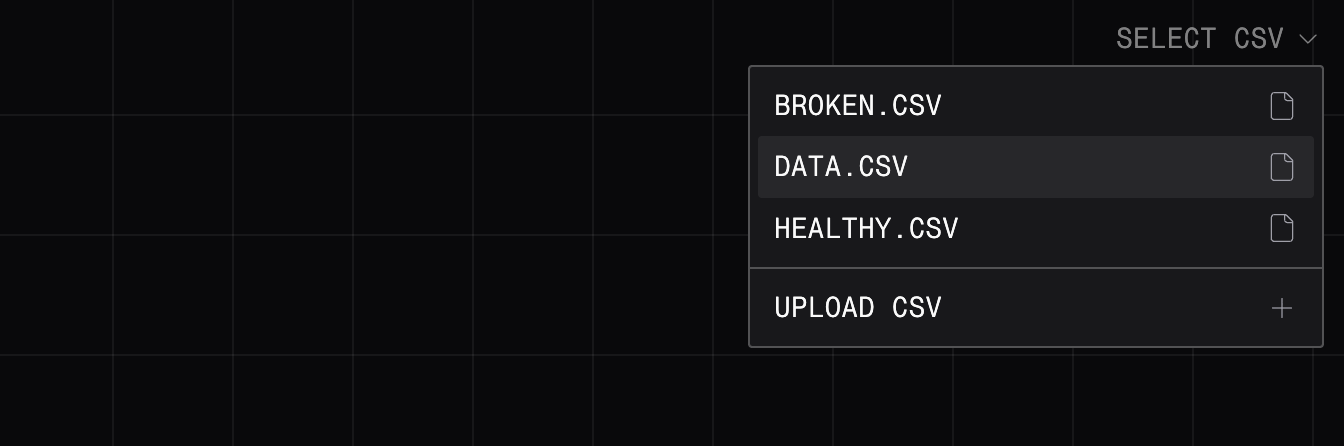 CSV files must be properly formatted with sensor recordings. Each row should represent a single time sample and include a timestamp column (unix time) and one or more numeric sensor channels (a1 to an).
## 4. Edit Lens Parameters
Lens parameters control how a Lens processes and analyzes data. To begin, add the n-shot examples provided below.
Click on the lens name to view and modify the Lens parameters.
Add N Shot examples that represent the states you'd like to classify.\
Download our sample CSV files to follow along:
* [healthy.csv](https://drive.google.com/file/d/1HK5EKvPWj_acMYB2SeBgAbzMEEtunn_6/view?usp=drive_link) - Normal operating conditions
* [broken.csv](https://drive.google.com/file/d/1hq1xyl9DBD_J1Legux3teypH1smvZfJm/view?usp=drive_link) - Equipment failure or malfunction
CSV files must be properly formatted with sensor recordings. Each row should represent a single time sample and include a timestamp column (unix time) and one or more numeric sensor channels (a1 to an).
## 4. Edit Lens Parameters
Lens parameters control how a Lens processes and analyzes data. To begin, add the n-shot examples provided below.
Click on the lens name to view and modify the Lens parameters.
Add N Shot examples that represent the states you'd like to classify.\
Download our sample CSV files to follow along:
* [healthy.csv](https://drive.google.com/file/d/1HK5EKvPWj_acMYB2SeBgAbzMEEtunn_6/view?usp=drive_link) - Normal operating conditions
* [broken.csv](https://drive.google.com/file/d/1hq1xyl9DBD_J1Legux3teypH1smvZfJm/view?usp=drive_link) - Equipment failure or malfunction
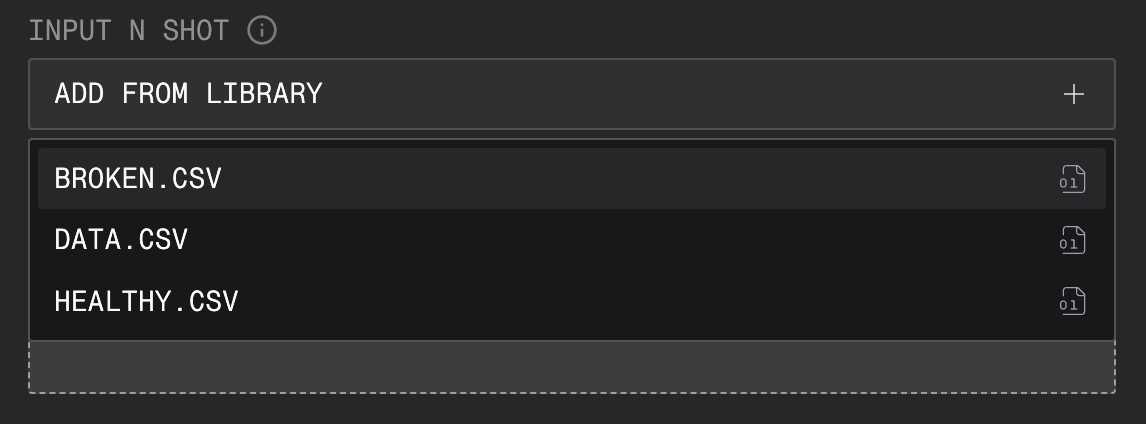 Learn more about the additional parameters such as window size, step size, and data columns when working with your own data [here](https://docs.archetypeai.app/core-concepts/lenses/lens-templates/machine-state).
## 5. Start Your Session and View Results
Begin the analysis by clicking the arrow button in the bottom right of the screen to start the session. The session will process your CSV data with the Machine State Lens and your specified focus.
Once processing begins, you'll see analysis results appear for your time series data. Click on any result to see the corresponding time window and view how the lens classifies different periods based on your labeled states.
```text Example Output theme={"system"}
[12:34:56] healthy
[12:45:12] broken
[13:02:34] healthy
```
## 6. Access Developer Logs (Optional)
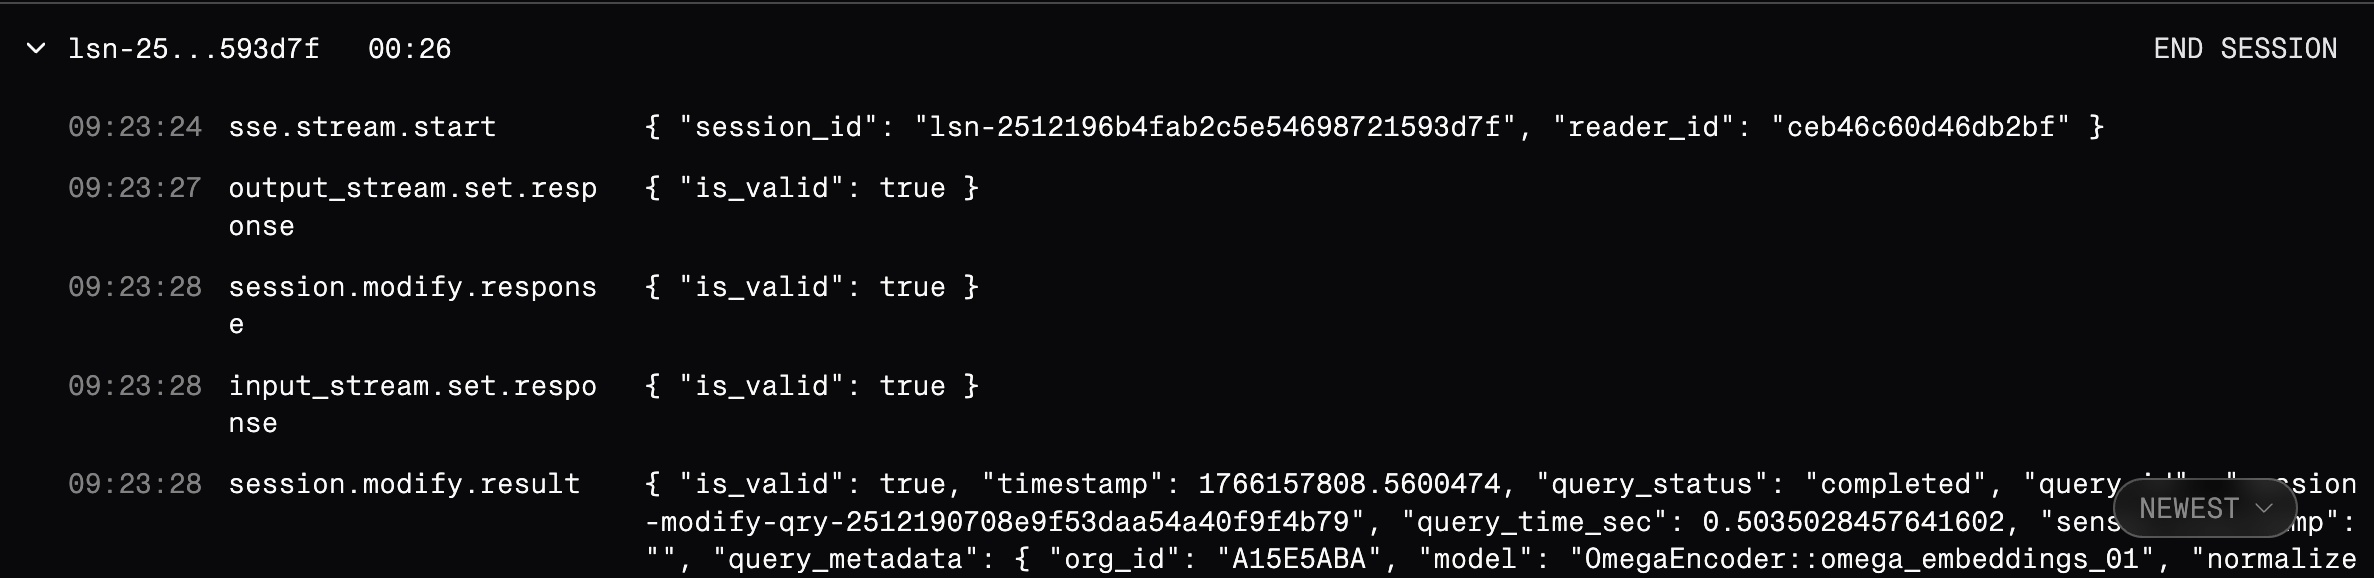
For debugging and detailed analysis, you can expand the session logs panel above the focus bar.
Learn more about the additional parameters such as window size, step size, and data columns when working with your own data [here](https://docs.archetypeai.app/core-concepts/lenses/lens-templates/machine-state).
## 5. Start Your Session and View Results
Begin the analysis by clicking the arrow button in the bottom right of the screen to start the session. The session will process your CSV data with the Machine State Lens and your specified focus.
Once processing begins, you'll see analysis results appear for your time series data. Click on any result to see the corresponding time window and view how the lens classifies different periods based on your labeled states.
```text Example Output theme={"system"}
[12:34:56] healthy
[12:45:12] broken
[13:02:34] healthy
```
## 6. Access Developer Logs (Optional)
For debugging and detailed analysis, you can expand the session logs panel above the focus bar.
 Congratulations! You've successfully run your first Lens Workbench session without writing any code.
## Next Steps
Try your own .csv files, and adjust the n shot examples and parameters based on your use case. A guide on recording your own data and examples is coming soon.
## Learn More
Try a quickstart tutorial in the terminal to get started with CSV files.
Ready to integrate Newton into your application? Explore the Lens API documentation
Congratulations! You've successfully run your first Lens Workbench session without writing any code.
## Next Steps
Try your own .csv files, and adjust the n shot examples and parameters based on your use case. A guide on recording your own data and examples is coming soon.
## Learn More
Try a quickstart tutorial in the terminal to get started with CSV files.
Ready to integrate Newton into your application? Explore the Lens API documentation